

At the end of 2025, the LNG carrier orderbook stood at 315 vessels, according to Veson Nautical data reported by Riviera Maritime Media. That's an enormous amount of cryogenic steel committed to moving gas between continents. It's also a misleading number to plan around.
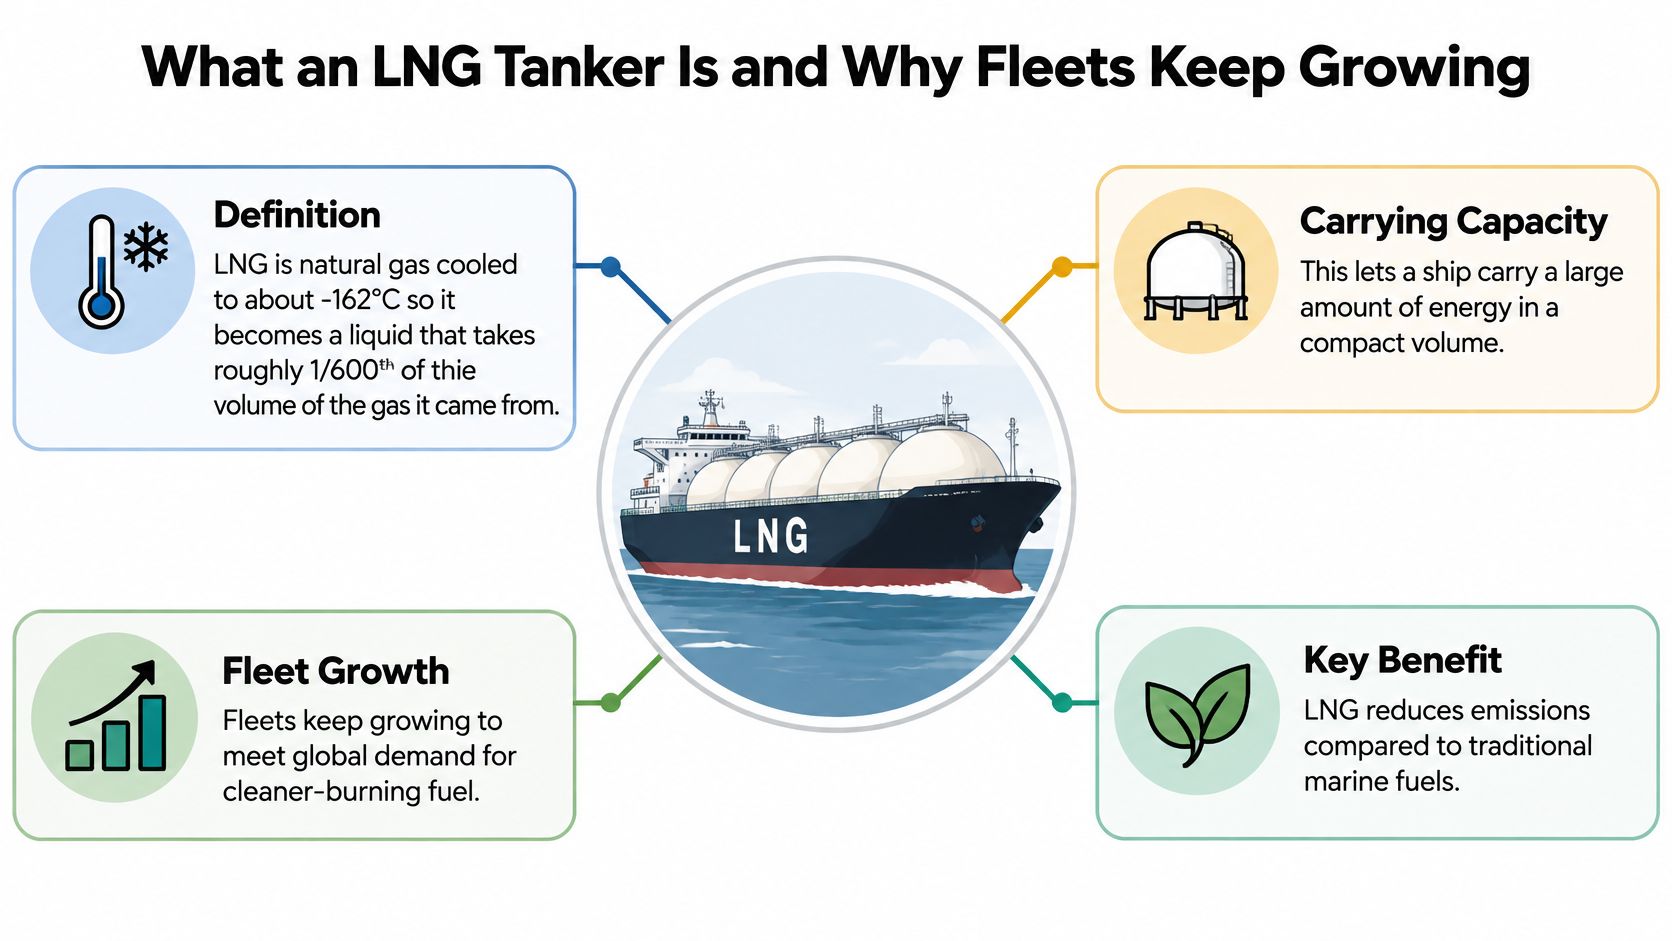
Liquefied natural gas is natural gas cooled to about -162°C (-260°F) until it condenses, at which point it occupies roughly 1/600th of the volume it held as a gas. An LNG tanker is the ship that carries that liquid from a liquefaction plant to an import terminal, or to a customer with no pipeline connection at all.
The figure that decides whether a plant keeps running isn't how many cubic meters a tank holds. It's how much of the cargo is still liquid, and still cold, when the ship ties up at the berth.
What an LNG Tanker Is and Why Fleets Keep Growing
An LNG tanker is a double-hulled ship fitted with insulated cargo tanks that hold gas close to its boiling point for the length of a voyage. It's a moving cold store rather than a pressure vessel, and that difference matters. The ship can't stop heat from reaching the cargo, so it manages what the heat does instead.
The fleet's scale shows how central that job has become. The global liquefied natural gas tanker fleet reached 772 vessels at the end of 2023, including 51 floating storage and regasification units and 79 smaller vessels of 30,000 cubic meters or less, with combined cargo capacity of about 114 million cubic meters, according to the GIIGNL 2024 annual report. GIIGNL also counted an orderbook of 341 vessels totaling 58 million cubic meters, equal to 51% of the existing fleet's capacity, with 89 ships scheduled for delivery in 2024.
The Three Links in the LNG Chain
Every delivery follows the same chain:
- Liquefaction at the plant. Gas is cleaned and cooled until it condenses, which is what makes it economical to move at all.
- Carriage by sea. The tanker holds the liquid cold and close to atmospheric pressure while managing the vapor that forms along the way.
- Regasification at the receiving end. A terminal stores the liquid, warms it back into gas, and sends it into a local network or a temporary supply arrangement.
Fleet counts move with definitions, so check what a number includes. The GIIGNL total counts small bunker vessels and small-scale carriers, while the 2024 World LNG Report counted 701 active vessels of at least 30,000 cubic meters at the end of February 2024. The same report notes the fleet grew 5.0% from 2022 to 2023 while LNG voyages rose only 1.7%, so carrying capacity was expanding faster than voyage demand.
The next question worth asking is what the ship is built like, and why a cargo this cold needs constant management from loading to discharge.
LNG Tanker Design Specifications at a Glance
Most of the world's LNG carriers share a recognizable shape. The Hong Kong Environmental Protection Department's project profile for a receiving terminal describes a conventional carrier as a double-hulled vessel approximately 285 m long, 43 m wide, and drawing about 12 m of water, with cargo capacity near 145,000 m³. Those figures decide most of what the ship can and can't do.
| Feature | Typical value | Why it matters |
|---|---|---|
| Length | about 285 m | Sets berth and terminal compatibility |
| Width | about 43 m | Limits canal and port passage |
| Draft | about 12 m | Restricts ports and channels with shallow water |
| Cargo capacity | about 145,000 m³ | Gross volume before boil-off losses |
| Hull | Double hull | Separates segregated ballast from cargo containment |
| Cargo pressure | Near atmospheric | Lets tanks be insulated rather than pressure-rated |
| Safety relief valves | Fitted to each cargo tank | Vent vapor if overpressure threatens |
What Each Dimension Decides
Length and beam are terminal questions before they're anything else. Berths, jetty arm spreads and turning basins are sized around a ship of this class, so a bigger newbuild can be a better ship and still be the wrong ship for a particular port.
Draft is the constraint that surprises planners most. A vessel drawing about 12 m can't enter a channel that is shallower, whatever its cargo capacity says, and tidal windows turn that into a scheduling problem rather than a design one.
Cargo capacity is the headline figure and the least reliable one. About 145,000 m³ is the volume loaded, not the volume delivered, because some of it leaves the tanks as vapor before the ship arrives.
Why the Hull and the Tanks Look the Way They Do
The double hull does two jobs. It separates segregated ballast from the cargo containment system so ballast water and cold cargo never share a boundary, and it puts a void space between the cargo and anything the ship might hit.
Because the cargo sits near atmospheric pressure, the tanks don't need thick pressure walls. They need insulation instead, which is why containment design is really a study in keeping heat out.
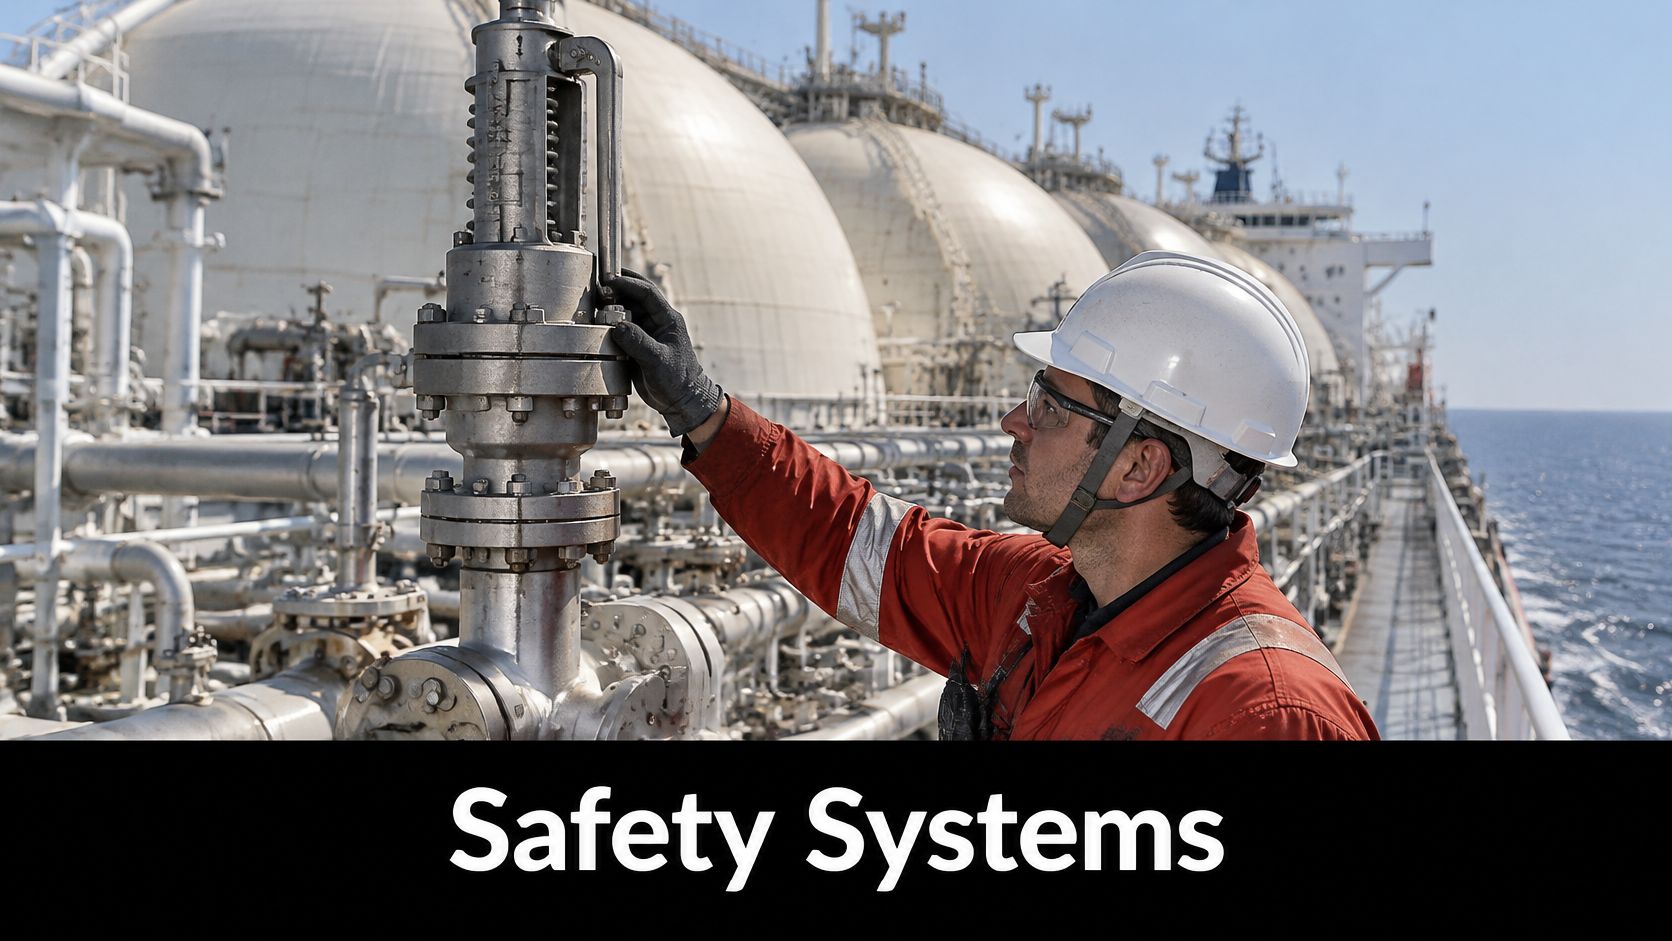
Each cargo tank also carries safety relief valves, so vapor can be discharged if fire exposure or abnormal heating threatens to overpressure it. That's a last line of defence, never a routine operating mode.
Two questions for any shipowner: how long is the voyage from load port to discharge port, and how much boil-off can this ship manage on that route? The answers change delivered volume more than tank size does.
How Cargo Tanks Keep Liquefied Gas Cold
A cargo tank on an LNG carrier works like a cold box built into the hull. Its job is to hold liquid at around -162°C while the sea outside sits at perhaps 20°C, and to do it without letting the hull structure get cold enough to crack.
Four Layers, Inside Out
From the cargo outward, a membrane tank runs like this: a thin metal barrier in contact with the liquid, a layer of insulation panels, a secondary barrier that contains liquid if the primary one leaks, and then the ship's inner hull. The hull never touches the cargo. It holds the insulation in place and takes the structural loads.
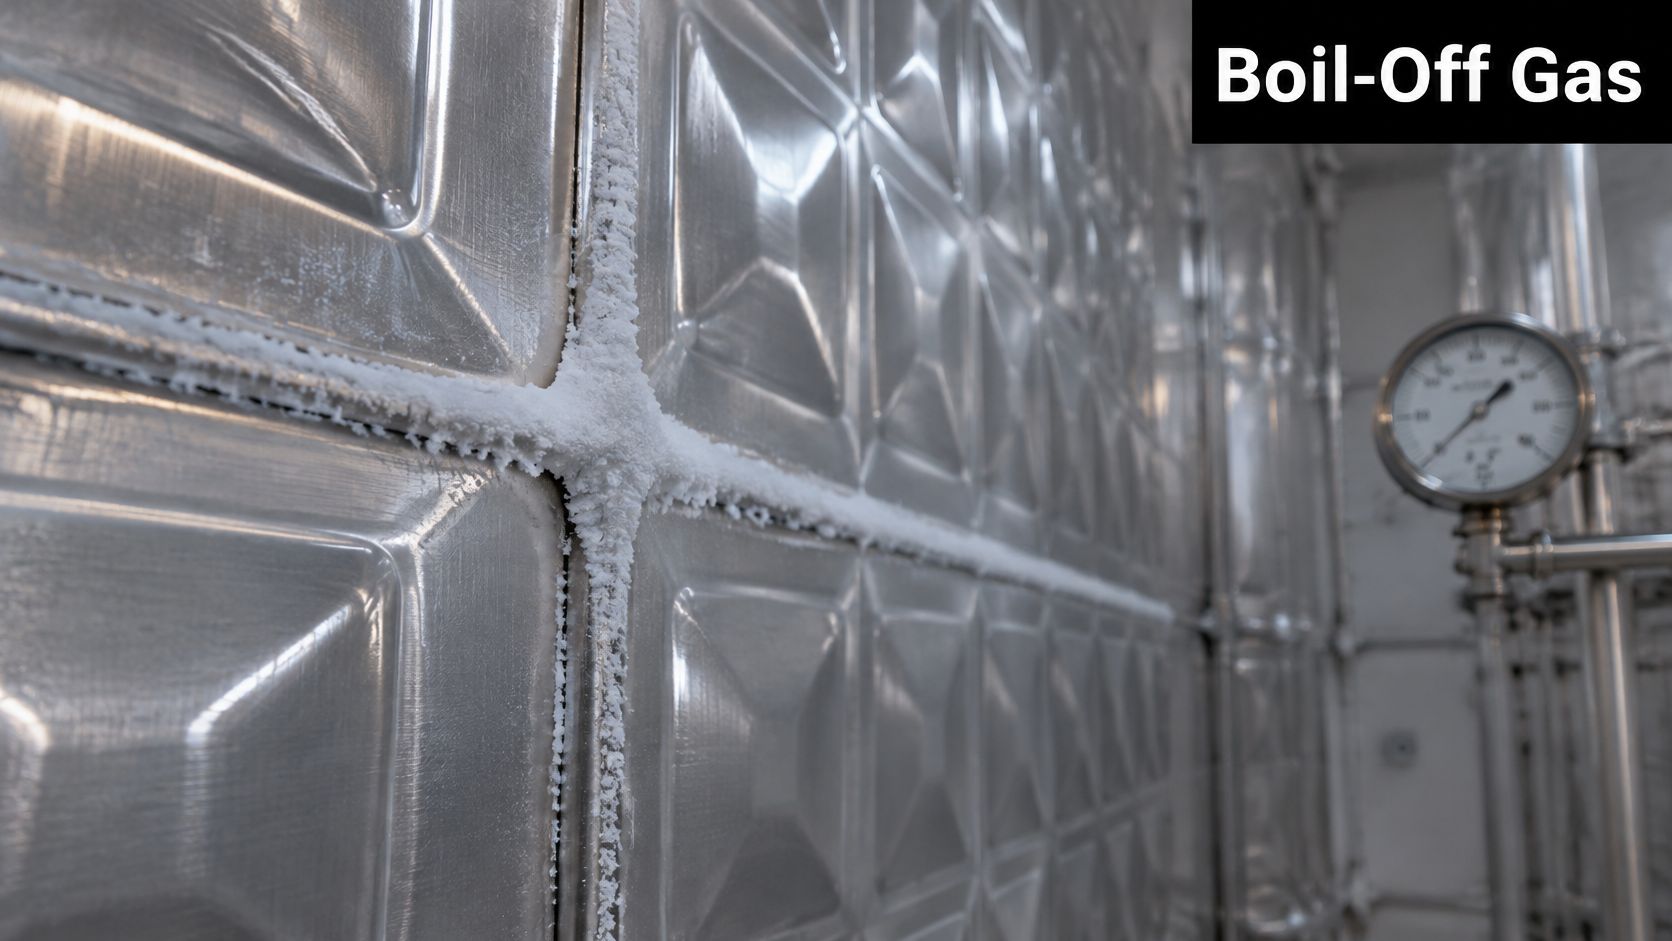
The thickness and condition of that insulation is the biggest single factor in how much gas the ship loses on passage. Heat leaks in through the hull, the insulation slows it down, and whatever gets through turns liquid into vapor. Better insulation buys time, and time is cargo.
Membrane and Spherical Tanks Compared
| Containment system | How it is built | Boil-off behaviour |
|---|---|---|
| Membrane | Thin metal barrier supported by insulation panels built into the hull | Low heat ingress; modern laden designs hold vaporization to a small fraction of tank capacity per day |
| Spherical (Moss type) | Free-standing aluminium spheres sitting inside the hull, inspectable from outside | Larger exposed surface for a given volume, so insulation quality and engine demand set how much vapor forms |
Membrane systems dominate new construction because they use the hull's shape efficiently and keep the deck clear. Spherical tanks consume more steel and leave more unused space, but they can be inspected from outside the tank, which some operators value on long-term charters.
For a buyer, the practical point is that two ships can advertise identical capacity and deliver different amounts of liquid. Containment type and insulation condition decide the difference, and neither shows up in a charter headline.
Ask for the containment type and the design boil-off rate, not just the cargo size. A ship that loses less cargo per day is worth more per voyage, especially on long routes where the days stack up.
Boil-Off Gas, the Constant Pressure Problem
LNG doesn't sit still in a tank. Heat reaches it through the insulation, a fraction of the liquid boils, and the resulting vapor raises pressure unless the ship does something with it. Boil-off gas is the constraint that turns nominal capacity into an actual delivered quantity.
| Daily boil-off rate | LNG-equivalent per day |
|---|---|
| About 0.07% (advanced membrane) | about 102 m³ |
| Below 0.10% (modern membrane) | about 145 m³ at 0.10% |
| About 0.15% (older or conventional) | about 218 m³ |
Modern membrane carriers commonly achieve laden-condition rates below 0.10% of tank capacity per day, with some designs approaching 0.07%, while older or conventional ships may sit closer to 0.15%, according to research on LNG boil-off management. On a 145,000 m³ cargo those rates mean roughly 102, 145 and 218 m³ of liquid vaporized per day.
The Arithmetic That Matters
Over a 10-day voyage, the gap between 0.10% and 0.15% comes to approximately 725 m³ of additional LNG-equivalent vaporization, and that's before loading, discharge, ballast operations or weather are counted. This is the point where a capacity figure starts to drift away from a supply figure.
Three Things a Ship Can Do With Vapor
- Burn it in the engines. Dual-fuel propulsion and onboard power systems consume boil-off as fuel. This is the commonest route, and it's why an LNG carrier's fuel bill is partly paid in cargo.
- Reliquefy it. A reliquefaction plant cools the vapor back into liquid and returns it to the tanks. It saves cargo but draws electrical power, so the cost moves rather than disappears.
- Send it to a gas-combustion unit. When vapor production exceeds what the engines and the reliquefaction plant can absorb, a combustion unit disposes of the surplus safely. Nothing is recovered, but pressure stays controlled.
Which route a ship uses on any given day depends on engine load. A vessel steaming at full speed can burn far more vapor than one idling at anchorage, which is exactly when vapor is accumulating.
The planning consequence: a boil-off rate is a delivery assumption, not a technical footnote. Any volume promised to a buyer should state the rate it assumes and the voyage length it applies to.
Safety Systems and Rules Onboard
A tanker isn't a container that waits indefinitely. U.S. rules require that a cargo tank which cannot tolerate pressure buildup for 21 days must control pressure through refrigeration, combustion, or approved use of boil-off gas as fuel, as set out in 46 CFR 154.703. In plain terms, a ship sitting at anchorage for a week has a vapor problem to solve every single day.
The Chain of Consequences
Longer waits mean more vapor that has to be consumed, reliquefied or safely disposed of. Terminal compatibility decides which of those options is available, because a receiving facility that can't accept vapor return or balance pressure removes one route entirely. Pressure control then moves from engineering detail into voyage planning, and a schedule built on the assumption of a fast turnaround starts to look fragile.
What the Crew Watches During a Delay
- Tank pressure trend. Rising pressure against falling engine load is the signal that vapor production is outrunning consumption.
- Boil-off flow split. The crew tracks what's going to the engines, to reliquefaction, or to the combustion unit, and whether that balance can hold through another day.
- Relief valve condition. These are the last defence against overpressure, tested and maintained so they don't become the failure point themselves.
- Vapor-return readiness ashore. Before discharge, ship and terminal agree the rates and confirm who takes the vapor back.
Gas detection in cargo spaces, compressor rooms and machinery spaces runs alongside all of it. That's continuous monitoring, not an inspection you schedule for convenience.
Cargo Preservation Is Not Emergency Supply
A ship's vapor systems exist to protect the ship and its cargo. They don't create a gas supply for a site ashore. Temporary LNG delivery needs its own storage, vaporization, odorization, regulation and site safety arrangements, plus the documentation that goes with them. Onshore, any facility that stores or handles flammable substances needs a documented dangerous-substance assessment, and in the UK that work is normally framed as a DSEAR risk assessment prepared by a specialist such as Opus Safety.
The safety story on an LNG carrier is mostly a vapor story. Preventing leaks matters, and so does managing the gas that is supposed to be there.
How LNG Is Transferred and Delivered Ashore
Ship-to-shore transfer is a choreographed sequence, and most of the risk sits in the transitions rather than in the transfer itself. A cargo at -162°C meeting ambient-temperature pipework behaves very differently from a warm liquid meeting a cold line.
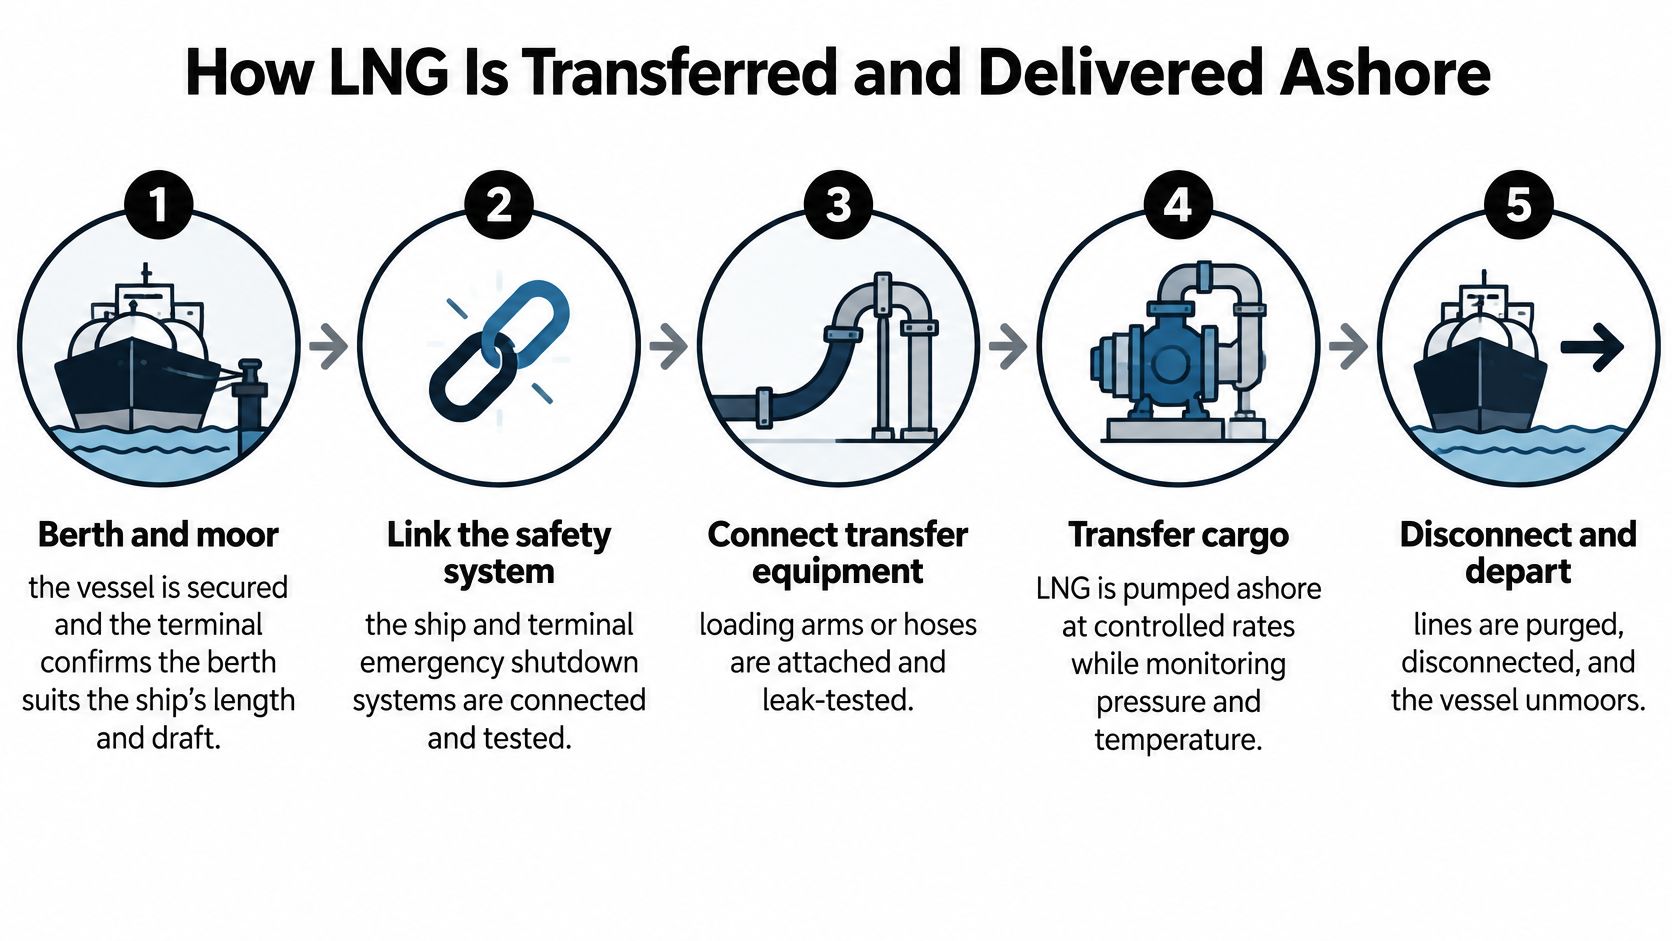
The Transfer Sequence
- Berth and moor. The vessel is secured and the terminal confirms the berth suits the ship's length and draft. Get this wrong and the arms won't reach the manifold.
- Link the safety system. The emergency shutdown link between ship and shore is tested before any cargo moves. The common slip is treating it as a formality. It's the handshake that lets either side stop the transfer.
- Connect the arms. Loading or unloading arms and the vapor-return line go on, then get leak-tested. Skipping the test to save half an hour is how small leaks become incidents.
- Cool the lines. Transfer lines are brought down to cryogenic temperature gradually, so liquid doesn't flash to vapor in warm pipework and spike the pressure.
- Transfer. LNG moves at the agreed rate while the crew watches tank pressure, cargo temperature and vapor return. Pushing the rate produces the pressure excursions that force a shutdown.
- Drain and purge. Lines are emptied and purged before disconnection, so no cold liquid is trapped where it can warm and expand.
- Disconnect and record. Arms come off and custody transfer quantities are logged against the ship's figures.
What Happens After the Ship
At an import terminal the LNG goes into insulated storage, gets regasified and leaves as pipeline-quality gas for a local network. At a site with no line, or a line still under construction, the cargo feeds a smaller arrangement: containers or tanks on site, a vaporizer, an odorizer and regulators feeding the building or the pipe.
The terminal's limit is seldom storage volume. It's usually the peak unloading rate and how much vapor it can accept back while receiving.
A transfer is on track when three things hold: quantities match between ship and shore, pressures stay inside the agreed range, and vapor return keeps pace with the unloading rate. If any one drifts, slow down rather than push through.
Emissions Questions Buyers Should Measure
LNG burns more cleanly than heavy fuel oil at the point of combustion, and that's usually where the comparison stops. The fuller picture includes the energy used to liquefy the gas, the methane that escapes upstream, and the methane that passes unburned through the ship's engines.
A 2025 study using 2024 supply-chain data estimated well-to-tank emissions for global LNG bunkering at 13.9 grams of CO2-equivalent per megajoule, with methane making up 16% of that total and liquefaction contributing 5.9 grams CO2e/MJ, of which 99% came from carbon dioxide, as summarized in SEA-LNG's key findings from the Rystad study.
| Metric | Figure | Basis |
|---|---|---|
| Well-to-tank LNG bunkering emissions | 13.9 g CO2e/MJ | 2025 study using 2024 supply-chain data |
| Methane share of well-to-tank total | 16% | Same 2025 study |
| Liquefaction stage emissions | 5.9 g CO2e/MJ | 99% of that stage from carbon dioxide |
| Onboard methane share of tank-to-wake GHG | 7 to 14% | Recent research summarized by Offshore Energy |
| Onboard emission reduction on newbuilds | 40 to 80% | Engine technology and after-treatment |
| Onboard emission reduction on existing vessels | 20 to 50% | Engine technology and after-treatment |
Methane Slip Is the Variable Buyers Miss
Methane slip is unburned fuel leaving the stack. Modern high-pressure engines reduce it substantially, and after-treatment can cut onboard emissions further, which is where the 40 to 80% range for newbuilds comes from. An older steam plant on the same route tells a different story.
Four Questions to Put to Any Supplier
- Which accounting method? Well-to-tank and tank-to-wake answer different questions.
- Which engine and which ship? Slip varies with technology, not with a fuel name.
- Which liquefaction source? Upstream and liquefaction can dominate lifecycle results.
- Which voyage length? A long route multiplies the fuel burned to carry the cargo.
Reporting frameworks around these numbers keep tightening. For operators with UK obligations, the SECR and TCFD reporting guidance from ESG Consulting sets out what has to be disclosed and how to structure the figures so they survive scrutiny.
Operational reliability and emissions performance are separate claims made about the same ship. Keep them separate when you evaluate a supplier.
Plan LNG Supply Around Realistic Delivered Volumes
A supply plan built on ship capacity will disappoint someone. Build it on delivered volume and the numbers hold. Three checks do most of the work.
- Convert capacity into delivered energy. Take the ship's daily boil-off rate and multiply by the voyage length. A 145,000 m³ cargo on a 10-day voyage at 0.10% per day loses about 1,450 m³ of liquid, roughly 1% of the load, before any other losses. On a 20-day route with a slower ship, the deduction doubles.
- Confirm the receiving end can take it. The terminal needs the peak unloading rate you're promising and a workable vapor-return arrangement. A site with tanks but no vapor-return plan will slow the discharge and stretch the schedule.
- Match the delivery window to the 21-day rule and to your own storage. The ship's pressure-control obligations run on a clock, and so does your tank inventory. If the gap between them is narrow, a delay becomes a supply interruption.
Those three inputs decide the delivered figure, and none of them appear on a vessel specification sheet. If you want a wider view of how gas moves from wellhead to burner tip, Kagool's oil and gas supply guide maps the stages that sit on either side of the ship.
Where a project can't wait for a pipeline, temporary supply fills the gap rather than replacing the calculation. We rent mobile natural gas units for buildings and pipelines and provide gas while customers wait for a permanent line, including sites with no pipeline service, with units deliverable anywhere in the US. Test any temporary option against the same three checks before committing.
Then ask for a single document: a delivered-volume estimate that states the boil-off allowance, the terminal limits and the delivery window it assumes.
Blue Gas Express delivers mobile natural gas where a pipeline can't reach yet, from LNG and CNG units that connect to a building or an existing line to turnkey vaporization sites with storage, vaporizers, odorizers and regulators. If a shipment, a terminal limit or a delayed gas line is putting your schedule at risk, we can scope a temporary supply around the delivered volume you need. Visit Blue Gas Express to walk through your site and get a plan moving.